Data-Driven Economic Growth Dashboard for Ho Chi Minh City: From Economic Signals to Policy Decisions
15 Sep, 2026


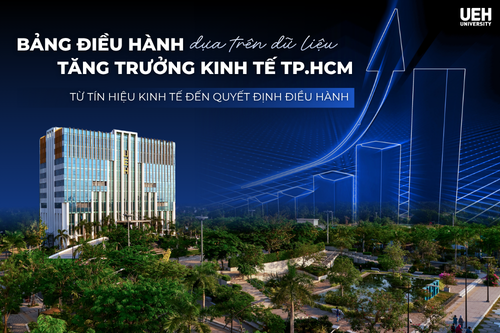
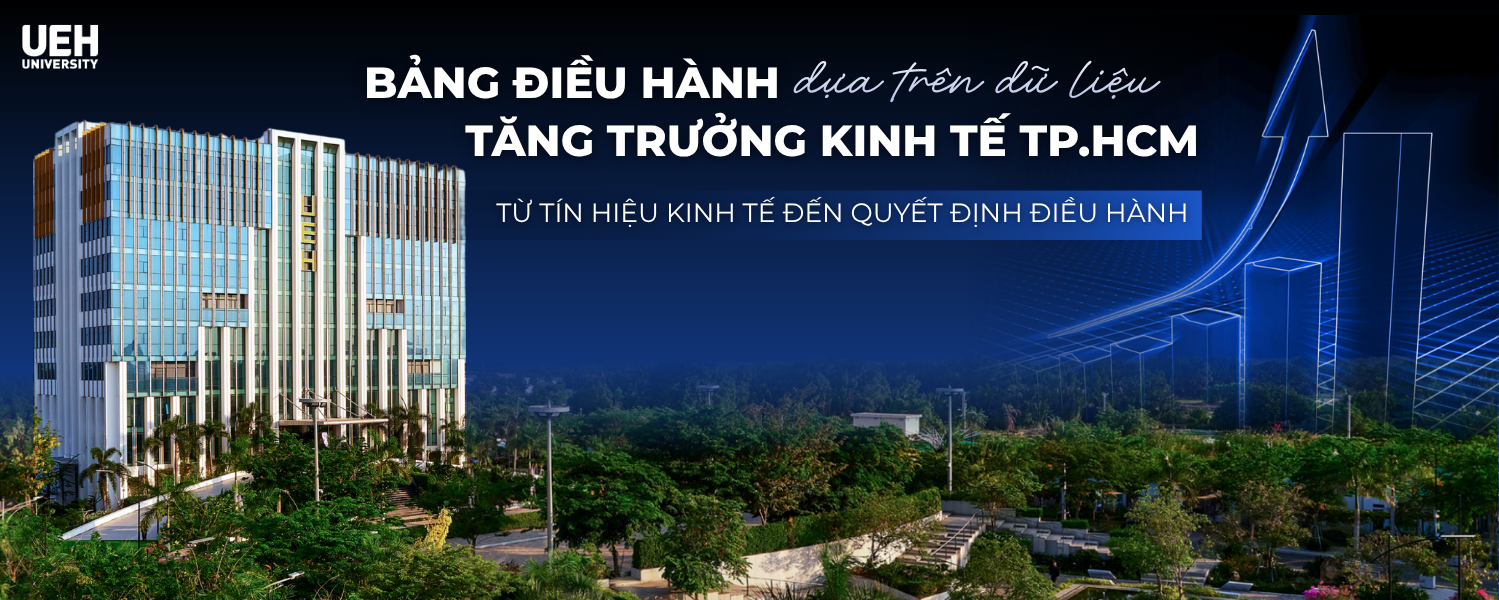
As Ho Chi Minh City enters a new phase of development, with growing demands for rapid and sustainable economic growth increasingly driven by productivity, science and technology, innovation, and digital transformation, economic governance must go beyond simply measuring “how much the economy has grown.” It must also identify emerging economic trends, understand the key drivers of growth, and anticipate potential risks in the coming quarters. In response to these practical needs, a research team from the University of Economics Ho Chi Minh City (UEH) has developed a model for the “Data-Driven Economic Growth Dashboard for Ho Chi Minh City,” aiming to transform data into meaningful insights that support informed decision-making.
From Data to Information for Economic Governance
The project was developed in the context of Ho Chi Minh City entering a new phase of growth with ambitious quantitative targets: average annual GRDP growth of 10–11%, a contribution of approximately 60% from total factor productivity (TFP), and the digital economy accounting for 30–40% of GRDP. At the same time, science and technology, innovation, and digital transformation have been identified as key drivers of economic growth.
However, three of the four major groups of indicators currently lack sufficiently frequent and regularly updated data streams to support continuous economic governance. Therefore, the challenge is not simply to collect more data, but, more importantly, to transform data into valuable information for decision-making.
Based on this approach, the UEH research team developed the Ho Chi Minh City Economic Growth Dashboard model following the value chain: Data → Indicators → Signals → Actions.
Under this framework, data are standardized and processed into indicators, which are then interpreted within historical contexts, trends, and monitoring thresholds to generate signals for analysis and economic governance. The Dashboard therefore serves as a bridge between data analysis and policy action, rather than merely visualizing existing statistics.
A distinctive feature of the model is its three layers of information, comprising reported statistics, derived indicators, and estimated indicators. Indicators such as GRDP nowcasts, TFP contributions, business cycle conditions, expectation indices, and early warning signals are generated through analytical models.
Accordingly, the Dashboard aims not only to indicate whether the economy is growing or contracting, but also to help identify why growth is changing, where its underlying drivers originate, and which signals require attention in the coming periods.
Eight Groups of Questions for a Comprehensive Economic Governance Overview
The Dashboard is designed with eight screens, corresponding to eight groups of questions that decision-makers need to address:
- Economic Governance Overview: What is the current state of the economy?
- Nowcasting and Business Cycles: What is happening before the quarter comes to an end?
- Aggregate Demand: Is demand strong or weak, and in which components?
- Growth Drivers: What factors are driving or slowing economic growth?
- Science, Technology, Innovation, and Digital Transformation: How far has the new growth model progressed?
- Structural Transformation: How is the economy undergoing structural upgrading?
- Institutions and Green Growth: What is the current state of the underlying enabling conditions?
- Expectations and Early Warnings: What might happen over the next one to three quarters?
This structure enables users to move from an overall economic overview to underlying causes, specialized areas of analysis, and forward-looking signals, rather than having to consolidate information manually from multiple separate reports.
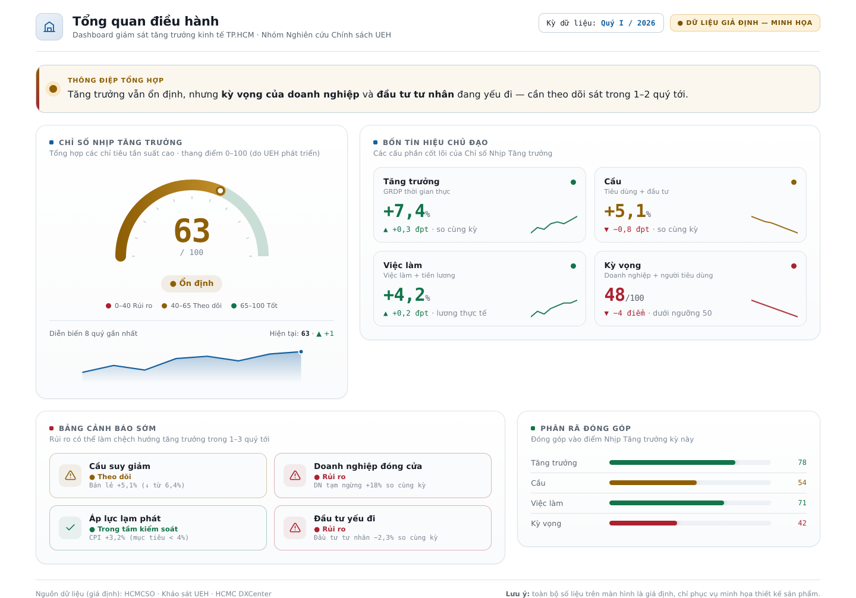
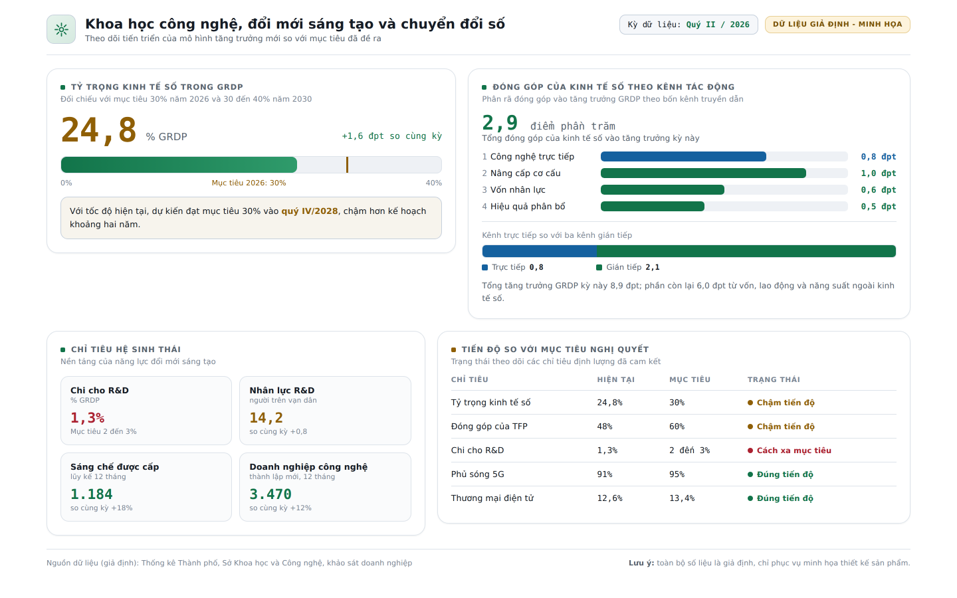
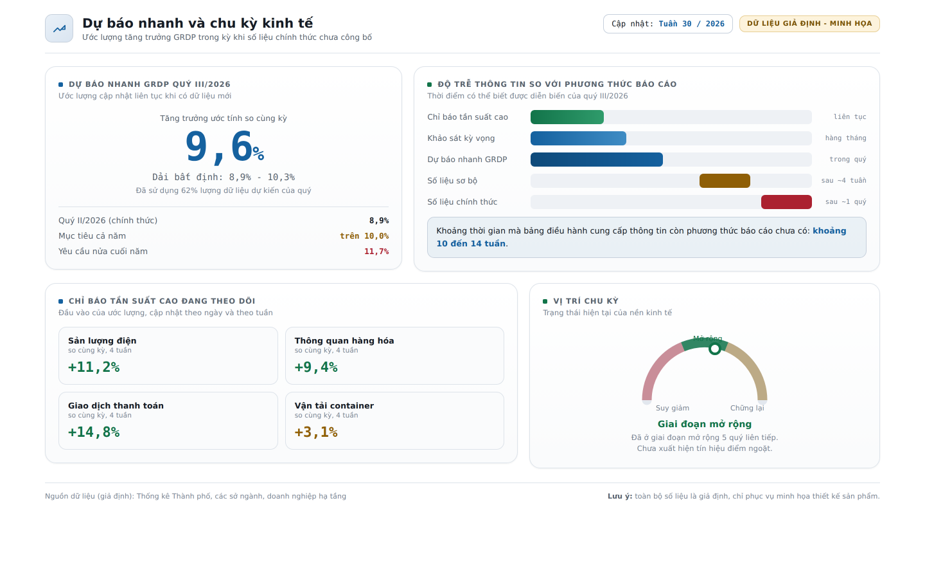
Interfaces of the Dashboard's screens
Behind the visual interface is a system of analytical methodologies developed by the UEH research team around four core capabilities: growth accounting to decompose the contributions of capital, labor, and TFP; quantifying the impacts of science and technology, innovation, and digital transformation; GRDP nowcasting and business cycle identification using high-frequency data; and composite indices and expectation surveys to provide additional signals for early warning purposes.
Gradually Refining the Data-Driven Economic Governance Model
To date, the UEH research team has developed a data-driven economic governance framework, designed eight functional screens and four analytical model components, and developed three prototype screens covering Economic Governance Overview; Nowcasting and Business Cycles; and Science, Technology, Innovation, and Digital Transformation.
The figures currently displayed on the three prototype screens are hypothetical data used for design purposes and do not yet represent actual calculations generated by the system.
In addition, the research team has completed the theoretical framework, indicator system, data strategy, software architecture, and technology transfer roadmap, establishing a foundation for subsequent implementation phases.
From Early Detection to Co-Creating Solutions for the City
Once completed and implemented with an appropriate data system, the Dashboard aims to support a transition from reacting to outcomes that have already occurred toward earlier detection and more proactive economic governance. High-frequency data and nowcasting methods enable trends to be monitored while an economic reporting period is still underway. At the same time, analytical models help explain the underlying causes of growth through factors such as demand, capital, labor, productivity, structural transformation, and the digital economy.
The project also seeks to translate strategic objectives into measurable and trackable indicators, particularly in relation to TFP, the digital economy, R&D, and innovation. In doing so, data become an integral part of identifying challenges and supporting informed decision-making.
More importantly, the “Data-Driven Ho Chi Minh City Economic Growth Dashboard” demonstrates how UEH translates its research capabilities in economics, econometrics, and data science into solutions addressing the City's practical development challenges. This initiative also represents a concrete step toward UEH's vision of a Co-Creation University, where the University connects knowledge with stakeholders to jointly address development challenges, gradually establishing a Value Co-Creation Ecosystem for Sustainable Impact for Ho Chi Minh City and the wider community.
Article and photos: UEH Research Team, Department of Communications and Partnership Development